Most advice about engineering metrics treats them like a shopping list: pick DORA, add some SPACE dimensions, throw in some cycle time, done.
But this approach ignores an important question: who needs this metric, and what will they do with it?
As an engineering leader, you need metrics that help you understand organizational health, identify systemic issues, communicate with stakeholders, and make confident decisions about where to invest. But you also need metrics that help your teams improve — not just chase a number.
Below, we’ll cover 20 essential engineering metrics for leaders, organized by what they help you understand: AI spend and impact, delivery performance, development flow, where engineering effort goes, team health, and codebase health — as well as what to do when these metrics start trending in an unwanted direction.
We’ve put the AI metrics first, because that’s where most of the questions are coming from this year. They also lean on everything else in the list: if you can’t see how work moves through your organization, an AI number on its own won’t tell you much.
Engineering metrics for teams versus about teams
Most conversations about metrics gloss over an important distinction: not all metrics share the same purpose.
Engineering leader and organizational developer Lena Reinhard has a useful framework for thinking about this:
Engineering metrics for teams are the ones teams actively use to improve. These show up in retrospectives, inform working agreements, and help teams spot their own bottlenecks. A team looking at their review time metrics and deciding to set up Slack notifications for waiting PRs — that’s a metric working for the team.
Engineering metrics about teams give engineering leaders organizational visibility. These often work best in aggregate, showing patterns across multiple teams or tracking progress on company-level goals. When you compare deployment frequency across domains to identify where teams might need platform support, those are metrics about teams.
The difference is important, because forcing teams to improve metrics they don’t find useful breeds cynicism and gaming. Meanwhile, keeping organizational health metrics hidden from teams breaks trust. The goal should be transparency about both types of metrics, with clarity about their purpose.
Of course, some metrics do serve both purposes. Cycle time is one example, because it can both a) help teams identify where work gets stuck, and b) help leaders uncover issues across teams. You just need to be clear about how you’re using the data.
You can hear more from Lena about this concept and her approach to metrics in her conversation on the Engineering Unblocked podcast.
AI metrics: cost and usage
Every engineering leader is being asked some version of two questions right now: what are we spending on AI, and what are we getting for it. There’s no single metric that answers either one, which is how these conversations end up with somebody counting lines of AI-generated code.
The eight AI metrics below cover cost, flow, agents, and quality. None of them measure adoption for its own sake — getting the tools into people’s hands stopped being the hard part a while ago. Most of them can be broken down to the individual, and none of them should be.
1. AI cost by tool, team, and work
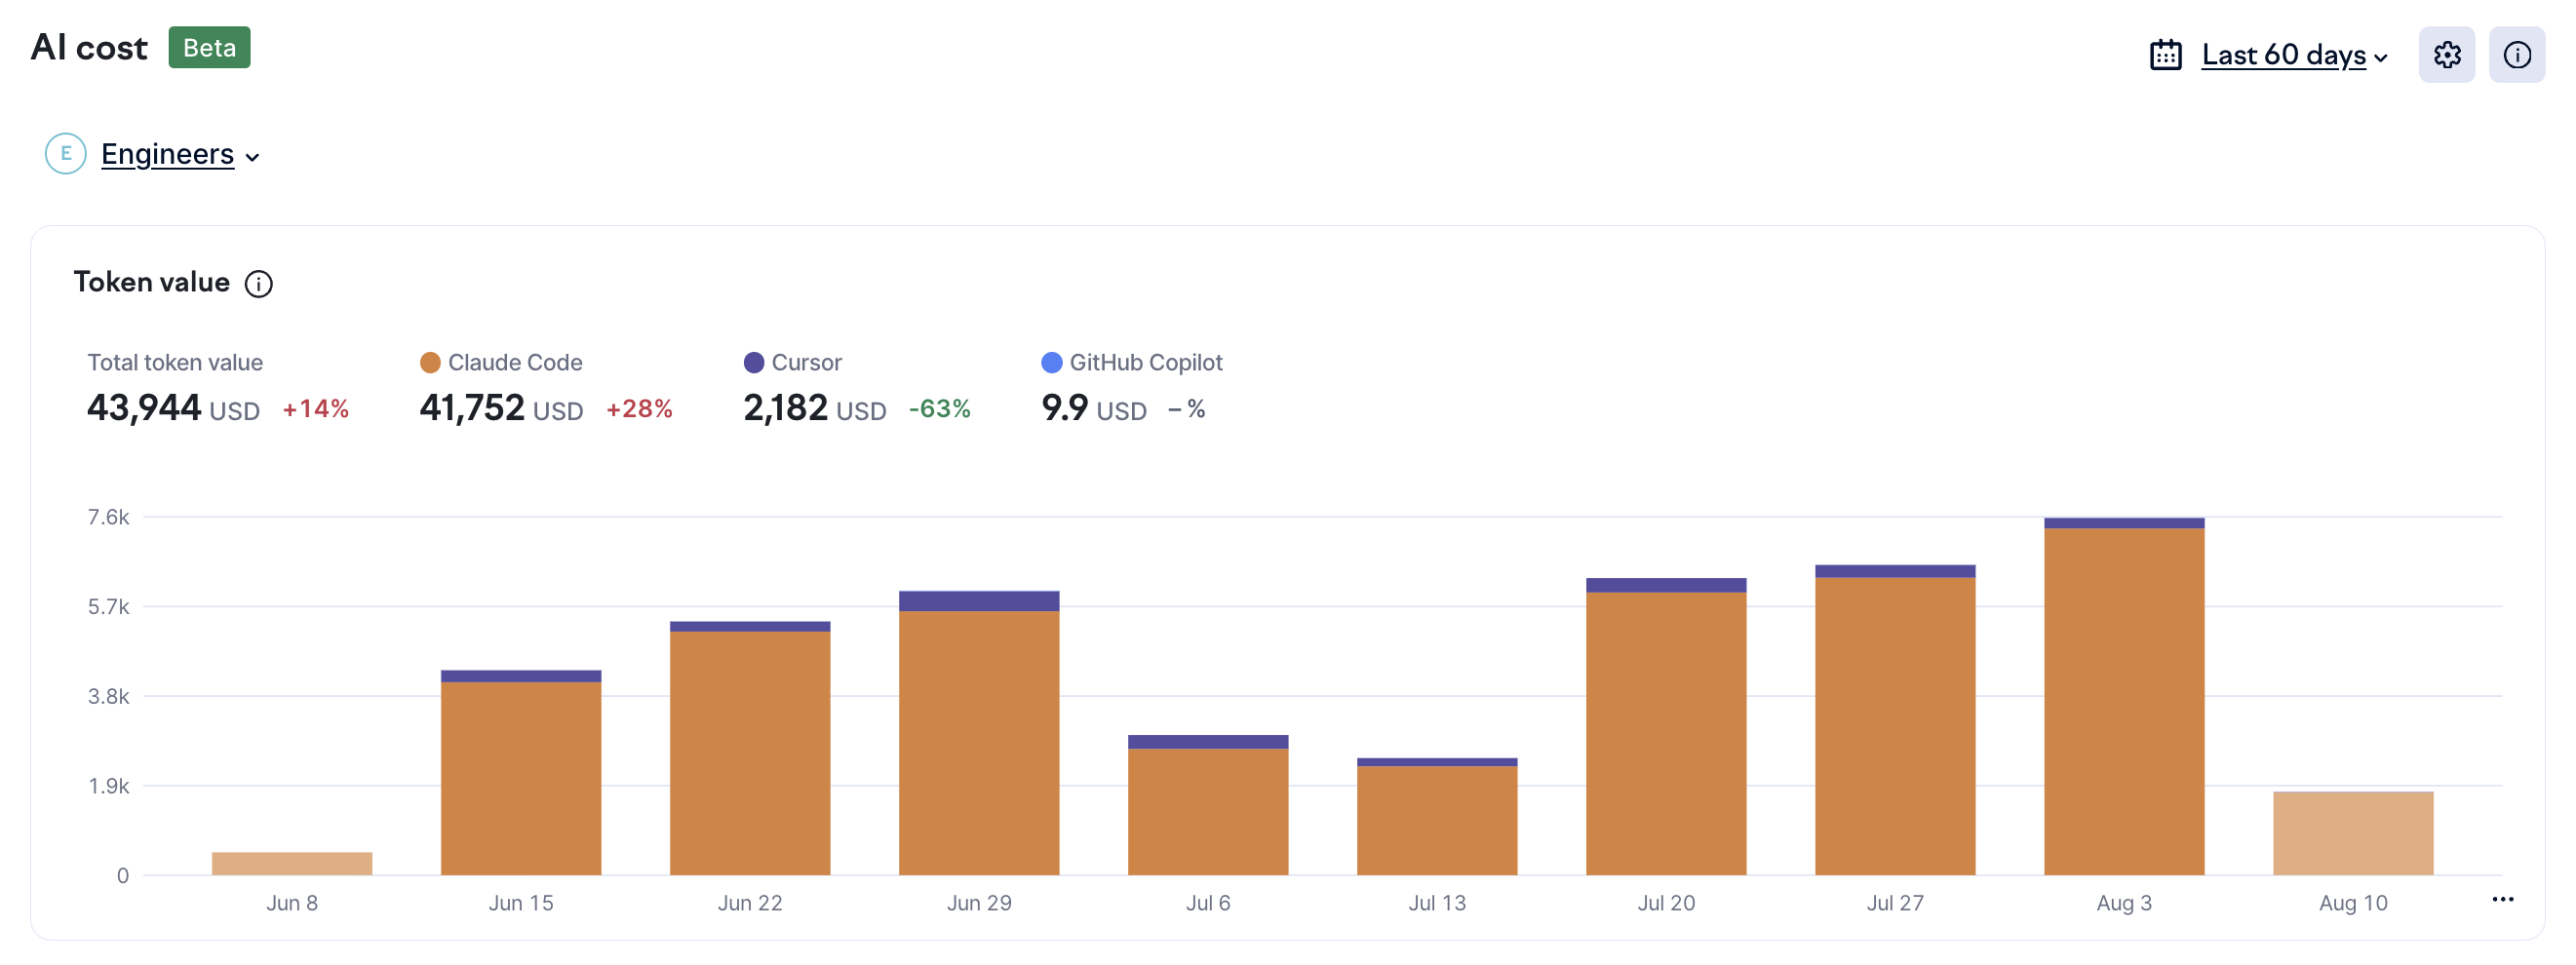
Every AI tool reports its usage differently: credits in one place, requests in another, raw token counts in a third. Comparing them takes a common unit. In Swarmia, that’s token value — the list price of the tokens each tool consumed, including the overhead agents add through system prompts, tool calls, and prompt caching.
AI cost by tool in Swarmia.
What it tells you: Which tools are eating the budget, and how that splits across teams. Agents burn tokens at a completely different rate from an engineer accepting completions, so two teams on the same number of licenses can run up bills an order of magnitude apart. It also settles whether a usage-based plan or a flat subscription suits the way your teams work.
What to do about it: Start with the teams whose spend looks out of line, in either direction, and find out what they’re doing differently. Then trace the spend to the work: Swarmia spreads each person’s daily usage across the issues and pull requests they contributed to that day, so you can see what a feature cost in tokens as well as in engineering time.
2. Cost per unit of output
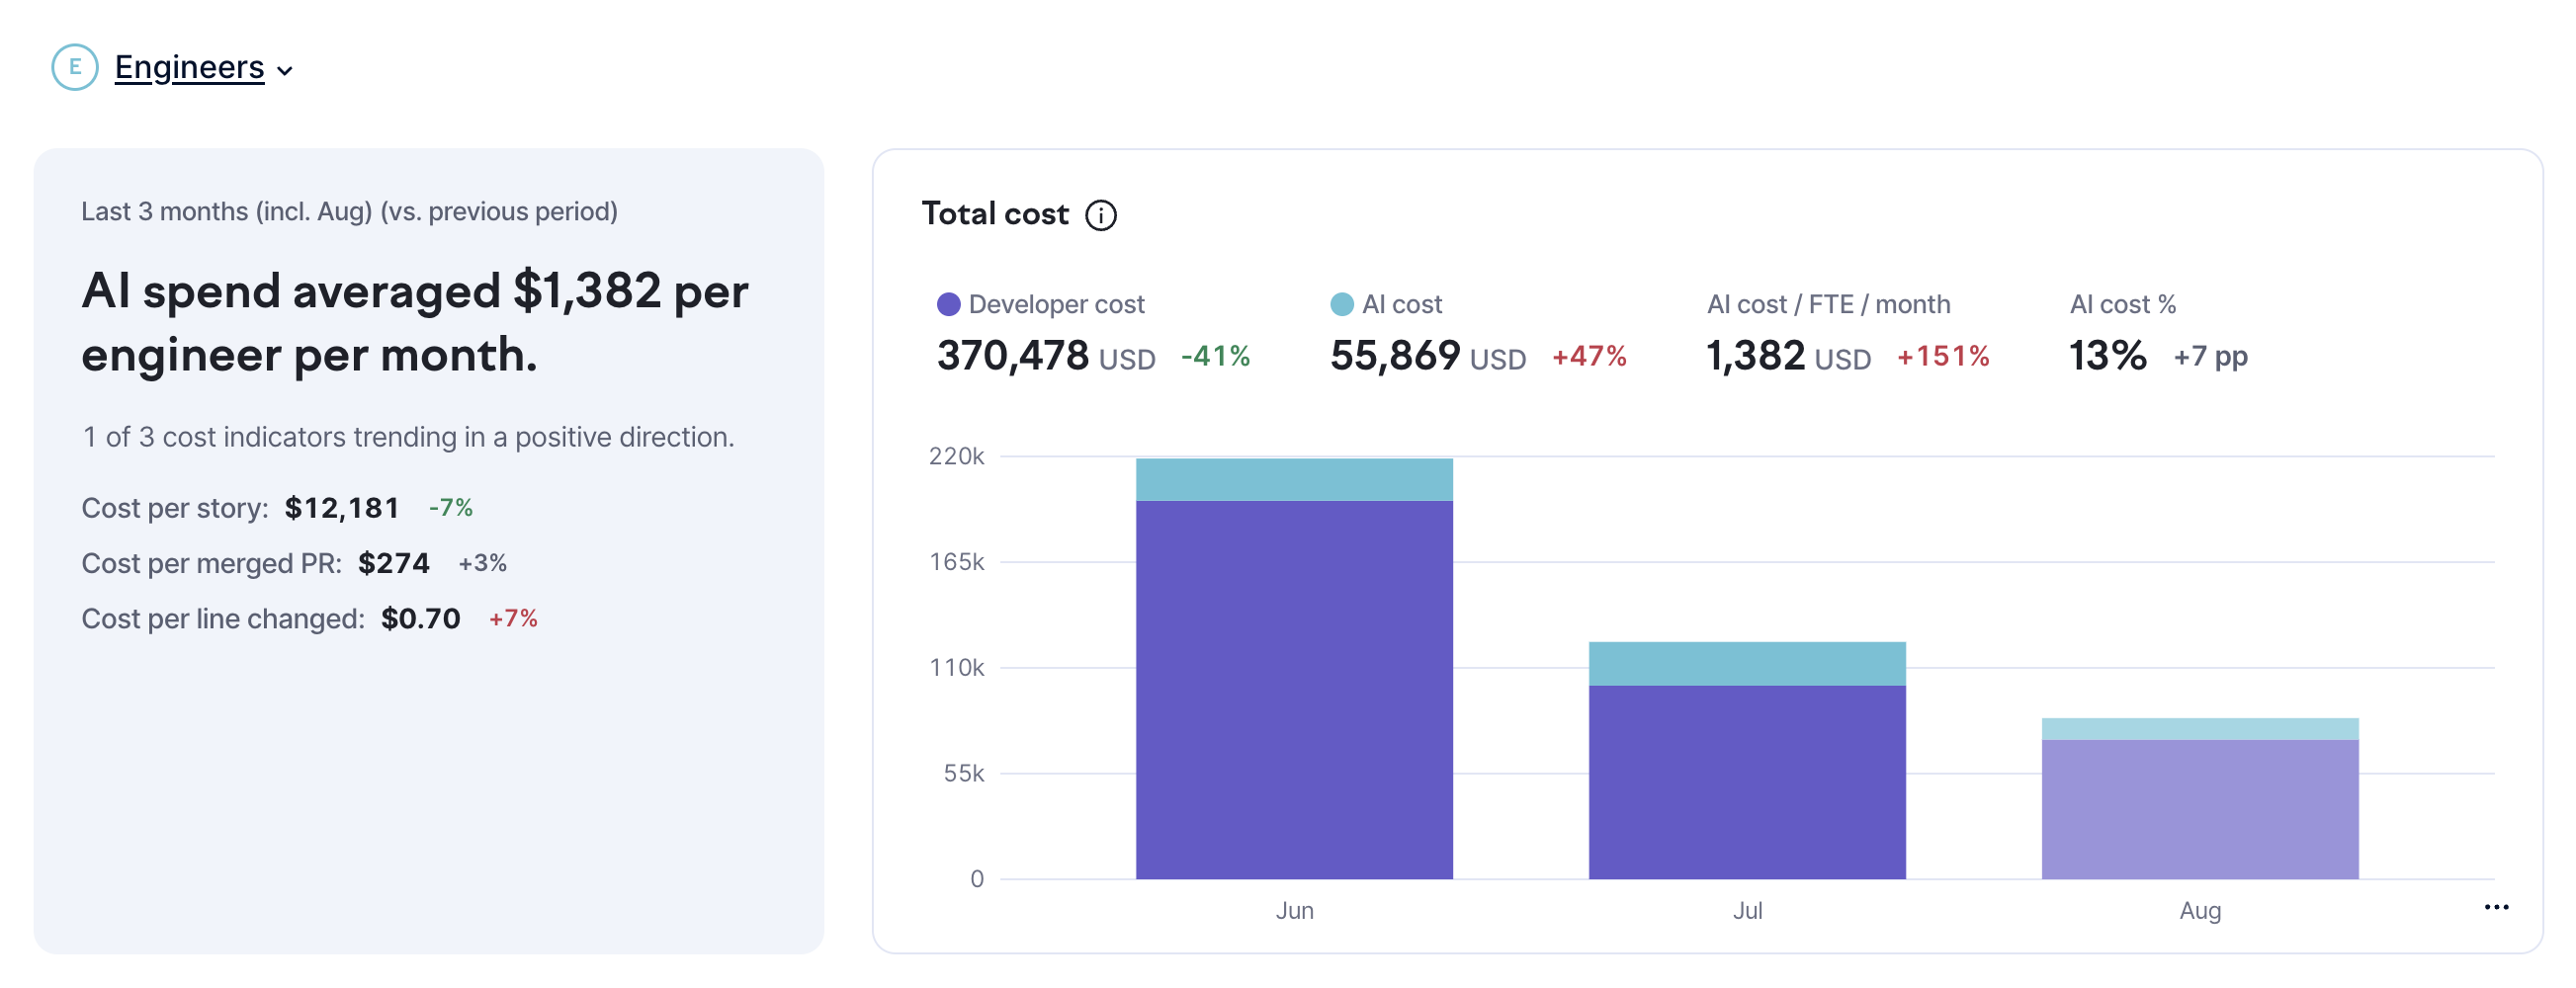
Your engineering cost and your AI cost on the same chart, against what teams shipped over the same period: stories and epics completed, pull requests merged, and lines changed, per FTE per month.
Cost per unit of output in the ROI tab in Swarmia.
What it tells you: Whether the money you’ve moved from salaries to tokens is buying you anything. If your AI cost share doubles while cost per merged PR drops, you’re getting more out of each unit of engineering effort. If cost per line falls while cost per PR climbs, your pull requests are getting bigger, and that extra code still has to be reviewed and shipped by people.
What to do about it: Read it across several months, not a single number, and start with the AI cost share — if AI is 3% of your engineering cost, there’s little to save by trimming the tool bill. Go carefully with cost per story: it’s the closest thing here to business value, and the first to stop meaning anything when teams change how they slice work.
3. Active use and idle licenses
Active use is the share of engineers who used each tool over a given period, next to the licenses you’re paying for.
What it tells you: How much you’re spending on seats nobody opens. If you bought 200 licenses in a company-wide rollout and 60 haven’t been touched in a month, that’s a line item you can cut this week. It also shows which tools engineers default to when they have several to choose from.
What to do about it: Reclaim the idle seats. For a tool that’s down to a handful of people, find out why they’re still on it before you cancel the contract.
How AI-assisted work moves through your pipeline
4. Share of AI-assisted pull requests
The share of your merged pull requests where an AI tool was involved, split by tool and by how it was used: assistance in the editor, pull requests opened end to end by a cloud agent, and pull requests reviewed by an agent.
What it tells you: Mostly a denominator for everything else in this section. The split is more important than the headline percentage, because an engineer accepting completions and an agent opening a dozen PRs overnight are totally different things to manage.
What to do about it: Use it to slice the metrics below, and get familiar with the detection before you take a number into a leadership meeting — editor-assisted changes are the fuzziest to spot, which is why Swarmia has a high-confidence toggle for them. Don’t set a target, though. Teams can move that number without changing how they work.
5. Flow metrics segmented by AI tool and mode
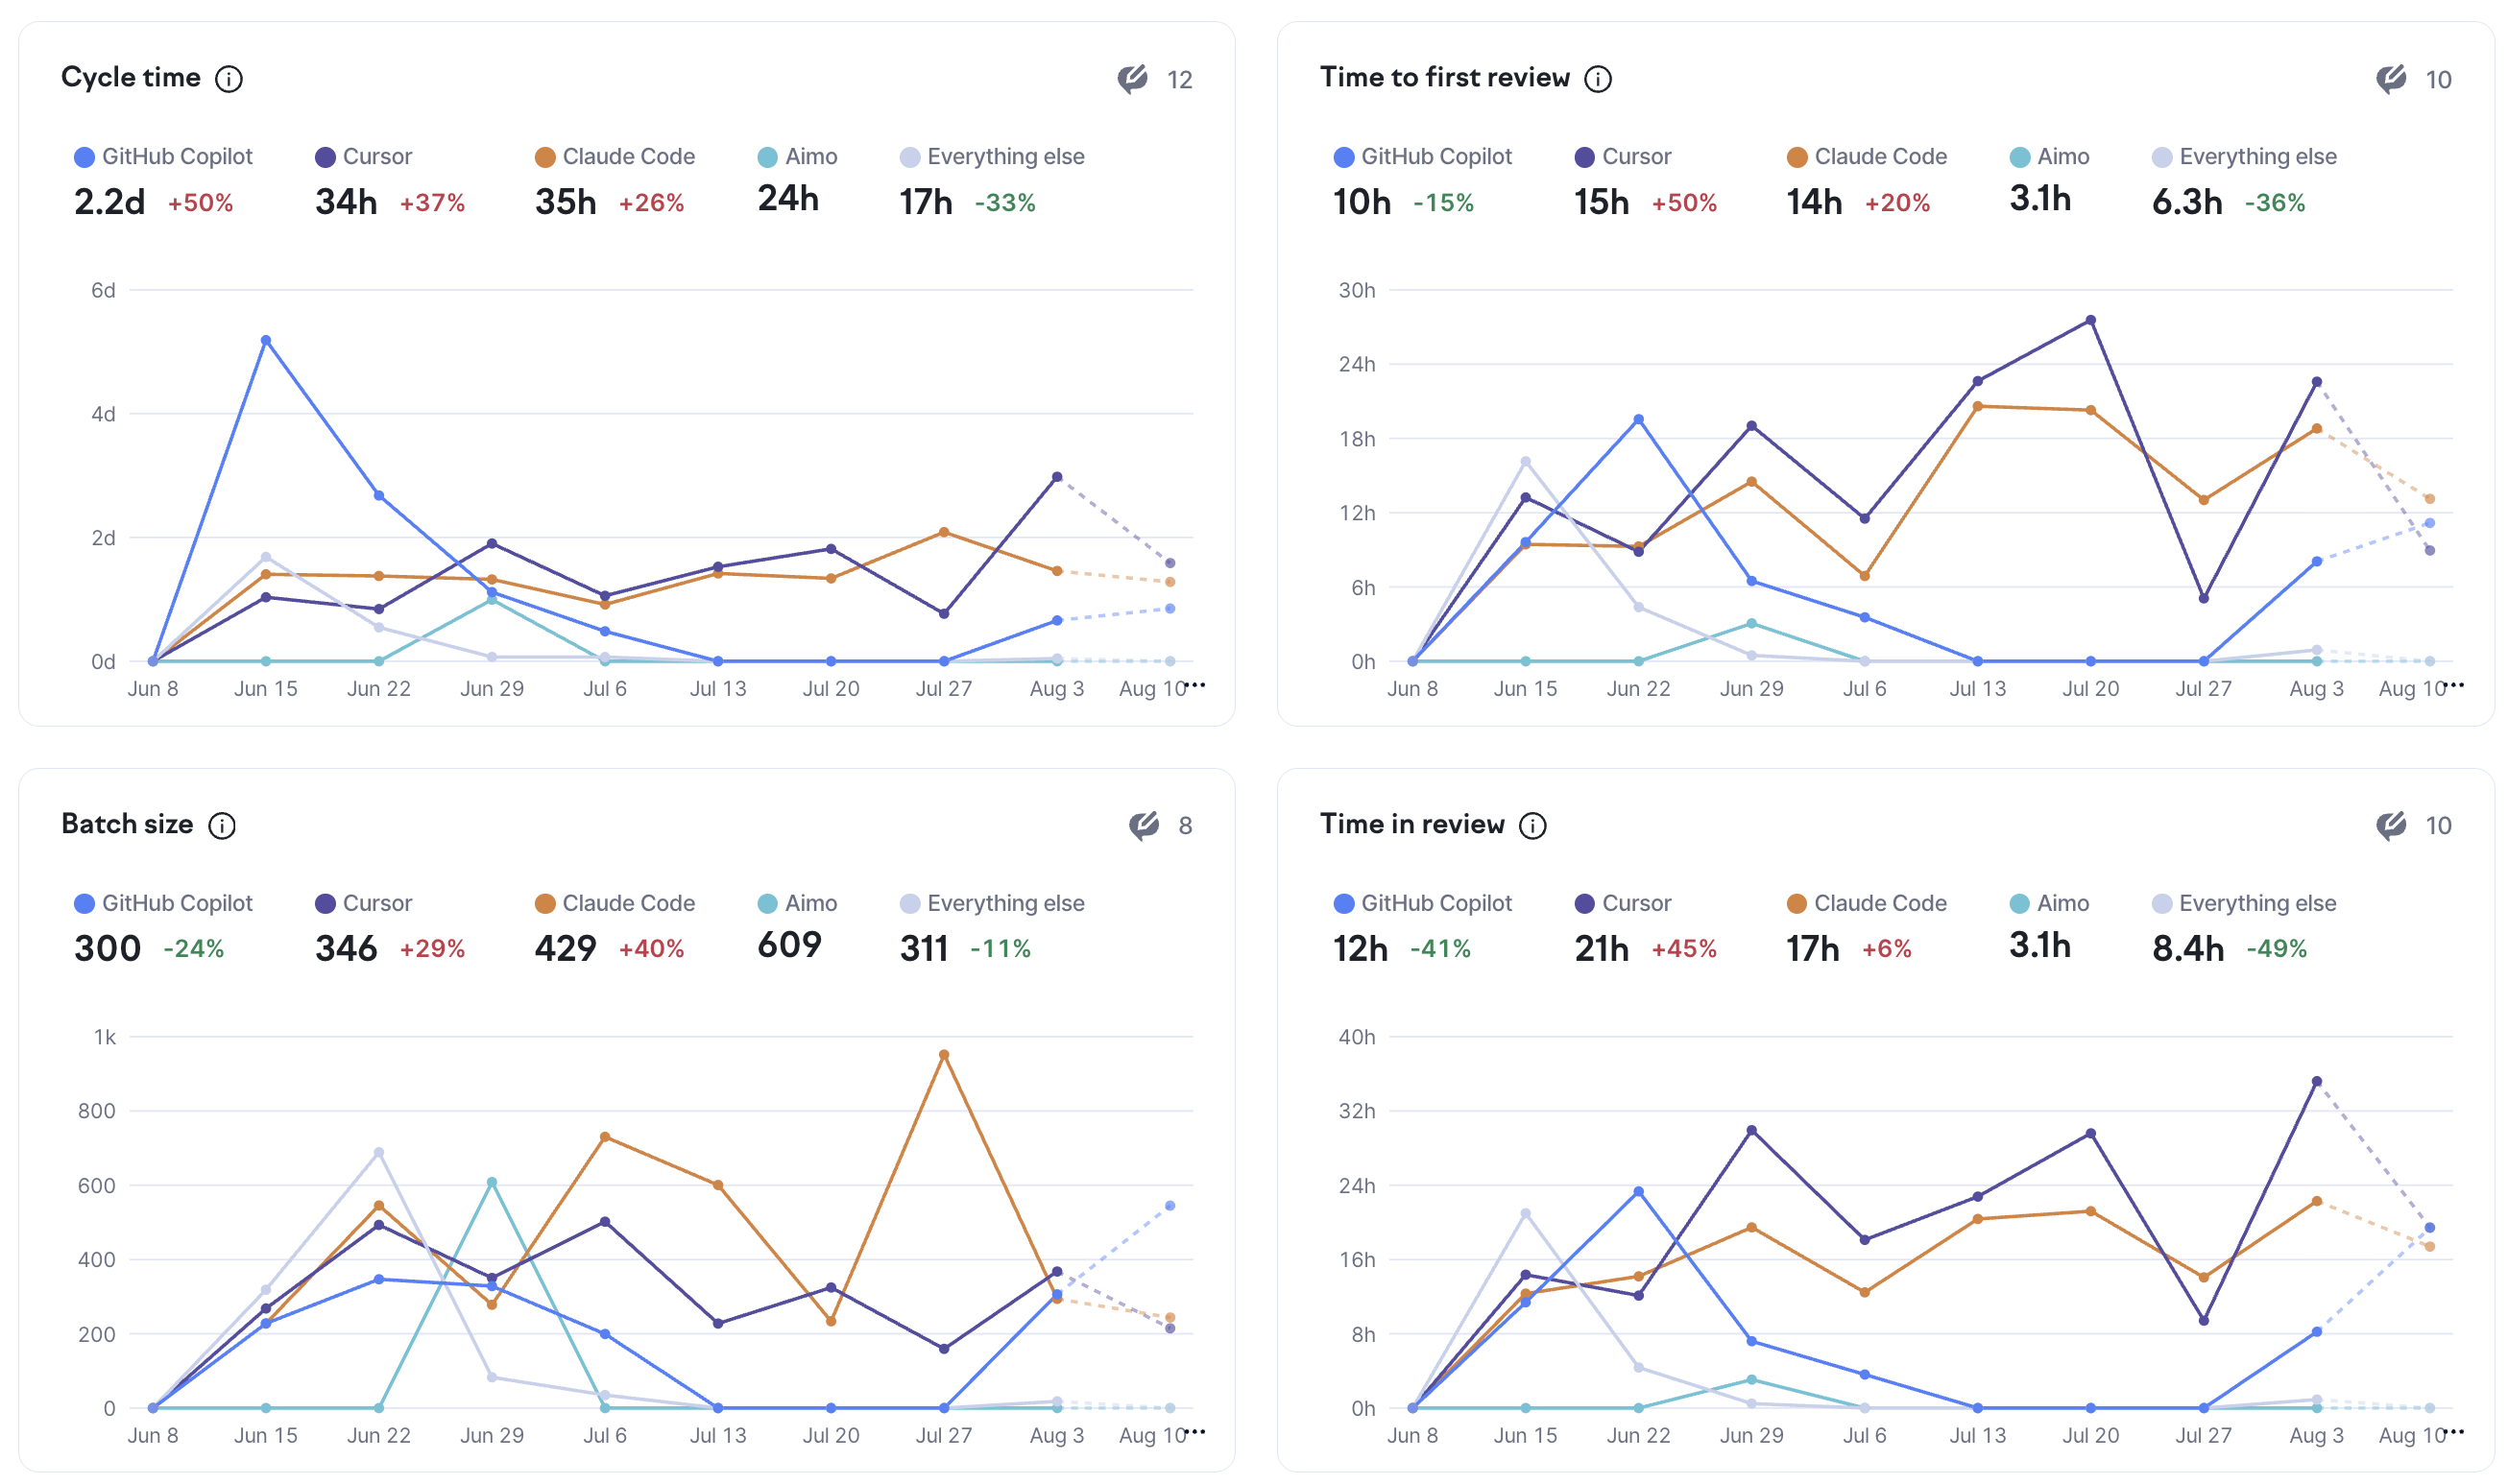
The metrics you already track — cycle time and each of its stages, batch size, throughput — split by which AI tool was involved, or none at all.
AI impact breakdown by tool in Swarmia.
What it tells you: Where AI is helping, and where it’s moving the queue around. The pattern a lot of teams run into is coding getting faster while review gets slower, so the work waits somewhere new and the end-to-end time barely budges. That’s a review capacity problem, and more tooling in the editor won’t fix it.
What to do about it: Compare teams to themselves over time, not to each other, since different repositories and different work move at different speeds with or without AI, and engineers pick which tasks to hand to AI in the first place. Change one thing — a batch size agreement, a review turnaround agreement, tighter scoping — and watch whichever stage was slowest.
Agent metrics
Agents open their own pull requests, which makes agent-authored work its own category, separate from PRs where a person used AI along the way. The two metrics below only apply to that category.
6. Agent work that reaches production
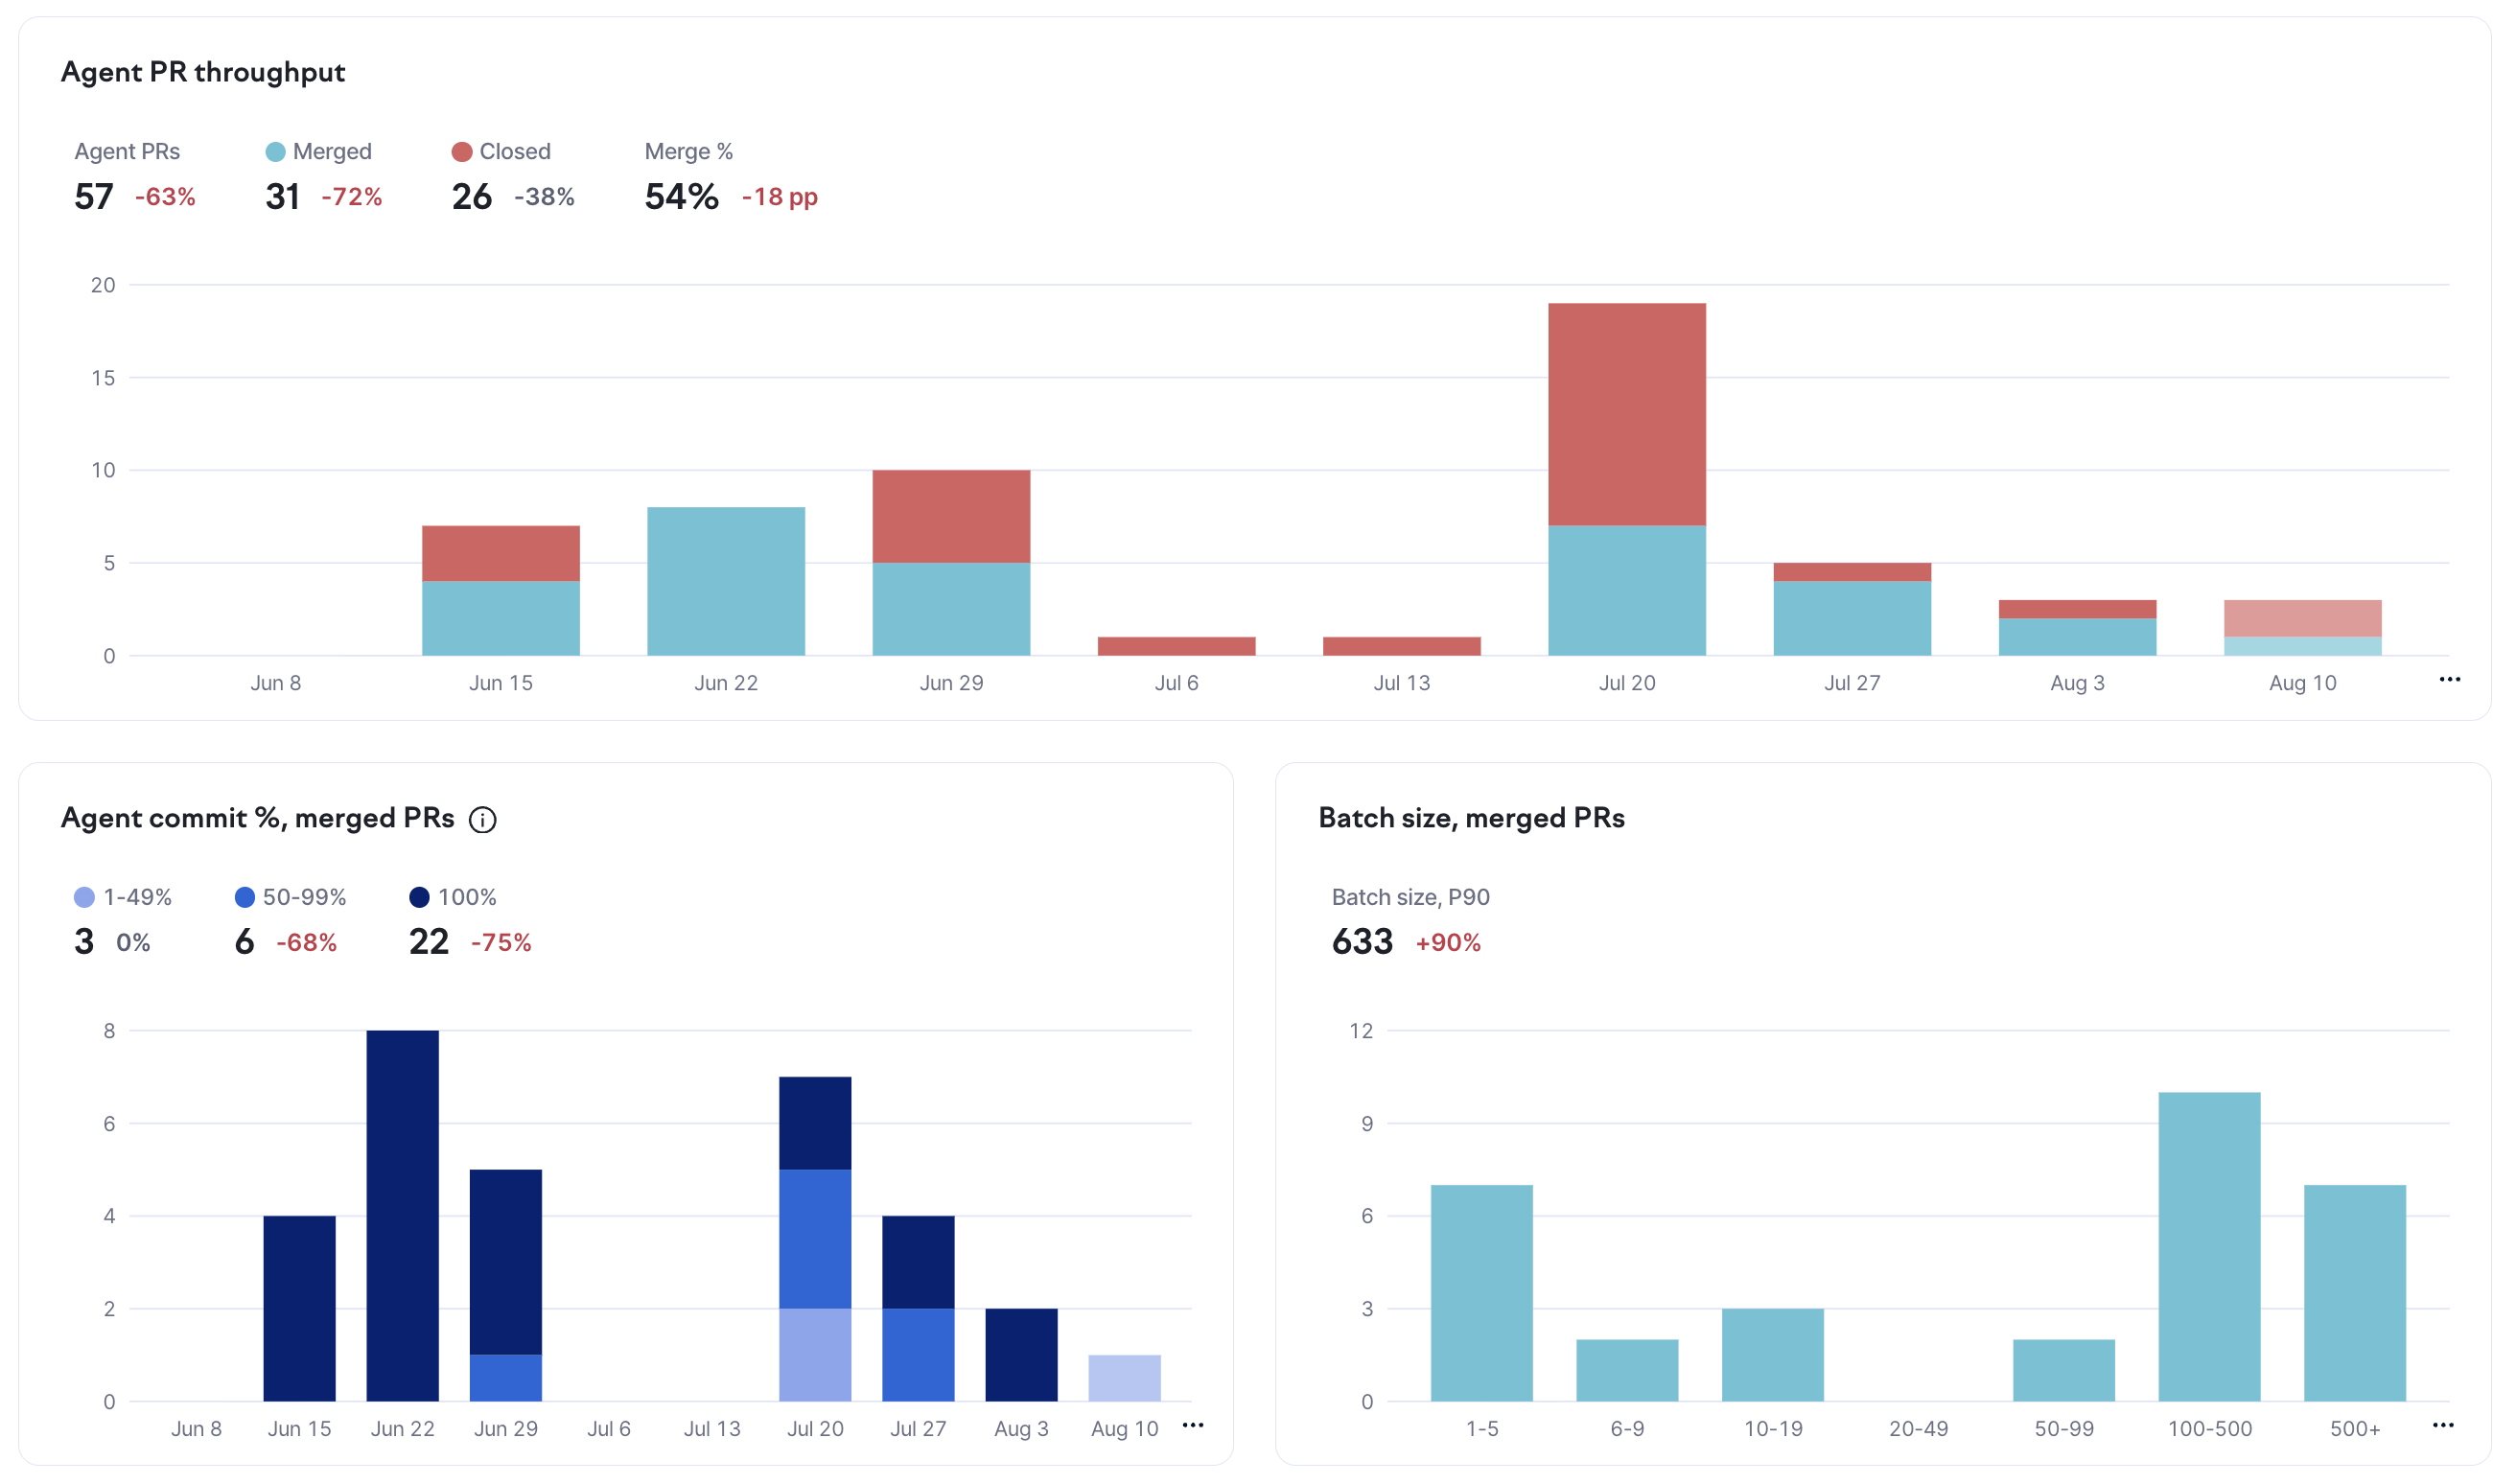
Because agents open their own pull requests, their output can be counted on its own: how many they opened, what share got merged, and how much of the work a person had to do to get each one over the line.
Cloud agent metrics overview in Swarmia.
What it tells you: Whether agent adoption is producing shipped software or a queue of code somebody else has to finish. Some share of closed PRs is healthy, because it means teams are finding the limits, but 100% merged deserves a second look — usually it means nobody is willing to throw anything away. When the human share of the work climbs across teams, the tasks being handed to agents have outgrown what agents can finish on their own.
What to do about it: Read it in aggregate before you read it by team, since one team running an experiment will skew the org-wide number. Where merge percentage is falling across several teams, the cause is usually upstream of the agent — vague tickets, thin test coverage, code that’s hard to follow — which makes it an investment question, not a coaching one.
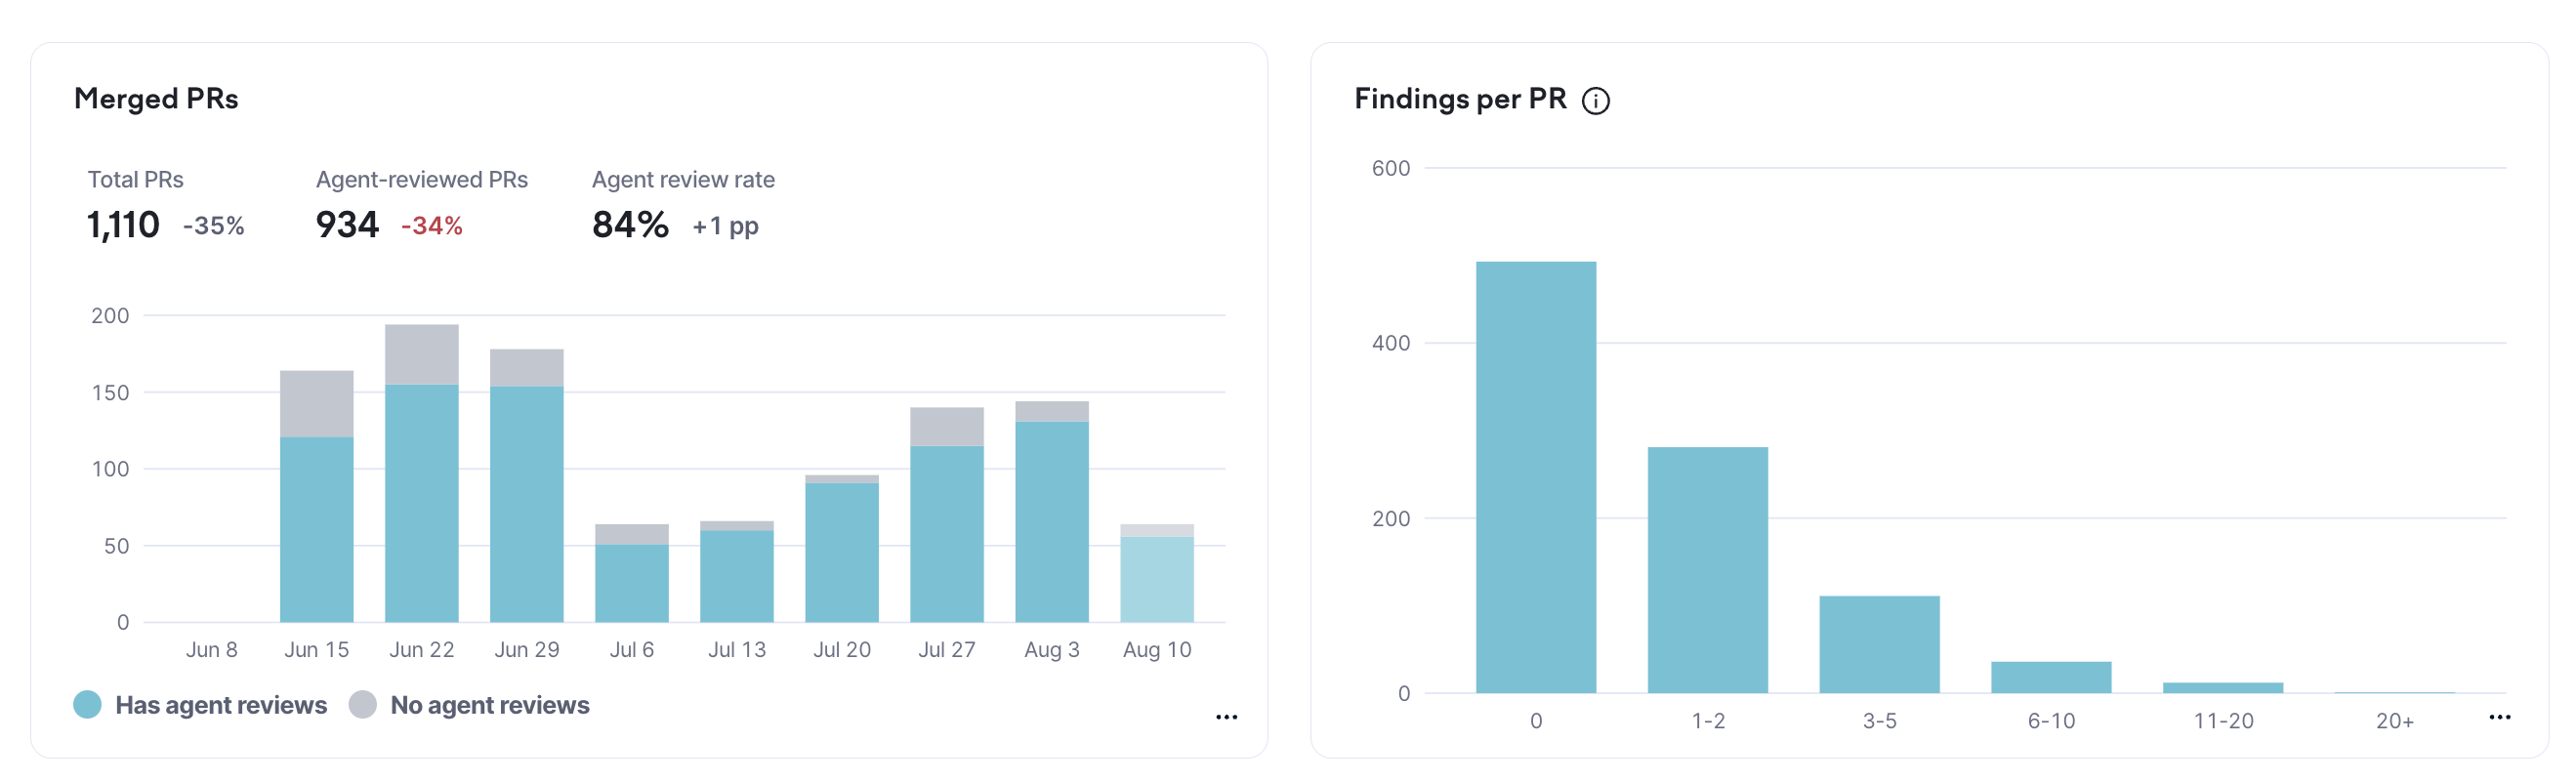
7. Review agent coverage and findings
Coverage is the share of your pull requests reviewed by each AI review agent. Findings per pull request is how much those reviews turn up.
Review agent coverage and findings count in Swarmia.
What it tells you: Whether the review agents you’re paying for are being used, and roughly what they’re contributing. Neither number reads alone. An agent surfacing one finding per PR might be looking at clean code, or skimming. One surfacing 15 might be catching problems that matter, or flagging every missing docstring in the diff.
What to do about it: Compare agents on the same repositories before a renewal, and have someone whose judgment you trust read a sample of the findings, because the aggregate won’t tell you whether they’re any good. Then watch human review comments per PR as coverage grows. If human review is thinning out because an agent got there first, your quality gates have changed, and that should be a decision, not a side effect.
AI and code quality
8. Quality and rework on AI-assisted work
The quality signals covered further down this article — change fail rate and deployment rework rate — split by whether AI was involved.
What it tells you: Whether the speed you gained earlier in the pipeline is being paid back later. It’s the counterweight to every throughput number above, and it’s usually missing when a team reports that AI has made them faster.
What to do about it: Watch the trend, not any single month, and go carefully with what you conclude. If change fail rate rose in the same quarter as AI adoption, you don’t know which caused which, or whether a reorg and a hairy migration caused both. So, take the numbers to the teams and ask what they’ve been seeing.
Software delivery performance metrics
We can’t write an article about engineering metrics without covering DORA. DORA metrics are usually used to talk about teams, but because they’re a shared language across engineering for understanding delivery health, they’re used both by engineering leaders and teams, albeit in different ways.
DORA metrics provide the clearest picture of your organization’s delivery capability and stability. And while many people still refer to the “four DORA metrics,” the framework evolved to include five metrics as of 2024.
The metrics are now grouped into two categories: throughput (how fast you can deliver) and instability (the quality and reliability of that delivery).
For high-performing teams, these metrics often stay healthy without anyone managing them directly. They’re an outcome of good practices, rather than a target to chase — think of them like a thermometer. Where DORA metrics become valuable is in spotting systemic issues across your organization, and keeping an eye on whether your engineering effectiveness efforts are working. That now includes your AI investment: if the tools are delivering what the vendors promise, this is where you’d expect to see it.
9. Deployment frequency
Deployment frequency is how often your organization ships to production. Elite teams (we’re talking about web-based software teams here, not mobile teams) deploy on demand, potentially several times a day. Infrequent deployers batch up large releases, and large releases generally cause large problems.
What it tells you: This metric works as a proxy for batch size and overall delivery capability. Deployment frequency dropping across multiple teams signals problems with your delivery infrastructure or growing process bottlenecks.
What to do about it: Examine your release process for manual steps, approval gates, or anxiety about deployments breaking things. Feature flags can help by separating deploying code from releasing it to users.
10. Change lead time
Change lead time is the time between when a task is started and when the resulting code is in production. Elite teams manage this in under a day. For some teams, it can stretch to a month or more.
What it tells you: When change lead time balloons, the work is spending most of its lifetime waiting — for code review, for QA, for a deployment window. The actual hands-on-keyboard time might be hours, but the total elapsed time weeks. This is also the metric most likely to stay flat while your teams write code faster, which is useful to know before you promise a lead time improvement on the back of an AI rollout.
What to do about it: If the goal is to reduce the amount of waiting time, a good place to start is introducing WIP limits, breaking work into smaller chunks, and investing in CI/CD and automated testing.
11. Failed deployment recovery time
Failed deployment recovery time is how fast you get back to a working state when something goes wrong. Previously known as mean time to recover (MTTR), this metric was refined in 2023 to focus specifically on failures caused by software changes rather than external factors like infrastructure outages.
What it tells you: This metric reveals the maturity of your incident response processes. Recovery time increasing across teams signals that your monitoring, runbooks, or rollback capabilities need work.
What to do about it: Make sure you have monitoring that catches incidents quickly, documented runbooks for common failures, and the ability to roll back or disable features instantly. How you respond to incidents shapes this metric — if the company response is finding someone to blame, people will hide problems rather than surfacing them quickly.
12. Change fail rate
Change fail rate (previously change failure rate) is the first of the two instability metrics, and is defined as the percentage of deployments that require immediate intervention following deployment. So think outages, rollbacks, and urgent hotfixes.
What it tells you: A certain amount of failure is healthy because it means you’re shipping and learning, and zero failures usually means you’re not taking enough risk. But if more than a quarter of your deployments cause issues, something’s wrong with your quality gates.
What to do about it: High failure rates almost always respond to better automated testing and smaller batch sizes. If the rate is climbing across teams, you might have quality problems or teams taking shortcuts under pressure. This is also the first place to look when you’re asked whether AI-assisted work holds up in production — see metric 8 above.
13. Deployment rework rate
Deployment rework rate is the percentage of deployments that are unplanned, but happen as a result of an incident in production. This metric was added to the DORA metrics in 2024, and it helps teams understand how much of their deployment activity is reactive instead of planned.
What it tells you: High rework rates tell you that teams are spending more time fixing production issues than delivering new value.
What to do about it: Like change fail rate, this metric improves with better testing practices and smaller batch sizes. But it also points to whether you’re accumulating technical debt or working on systems that need architectural improvements.
A note on reporting up before we move on: DORA metrics provide useful data for executive conversations about engineering performance, but the numbers alone don’t tell the full story. Focus on trends over time and what they reveal about your organizational capability.
If metrics are trending negatively, come prepared with your hypothesis about root causes and your plan to address them. And if they’re improving, connect those improvements to specific investments you made (better CI/CD, platform improvements, smaller batches, improved testing) and the business impact those changes enabled.
Understanding where work gets stuck
These engineering metrics are mostly for teams — they help teams identify their own productivity bottlenecks and drive daily improvements. As a leader, you’ll use them in aggregate to monitor patterns across teams.
They’re also the metrics that AI tends to disturb first, which is why segmenting them by AI involvement (metric 5) is more useful than watching the org-wide average.
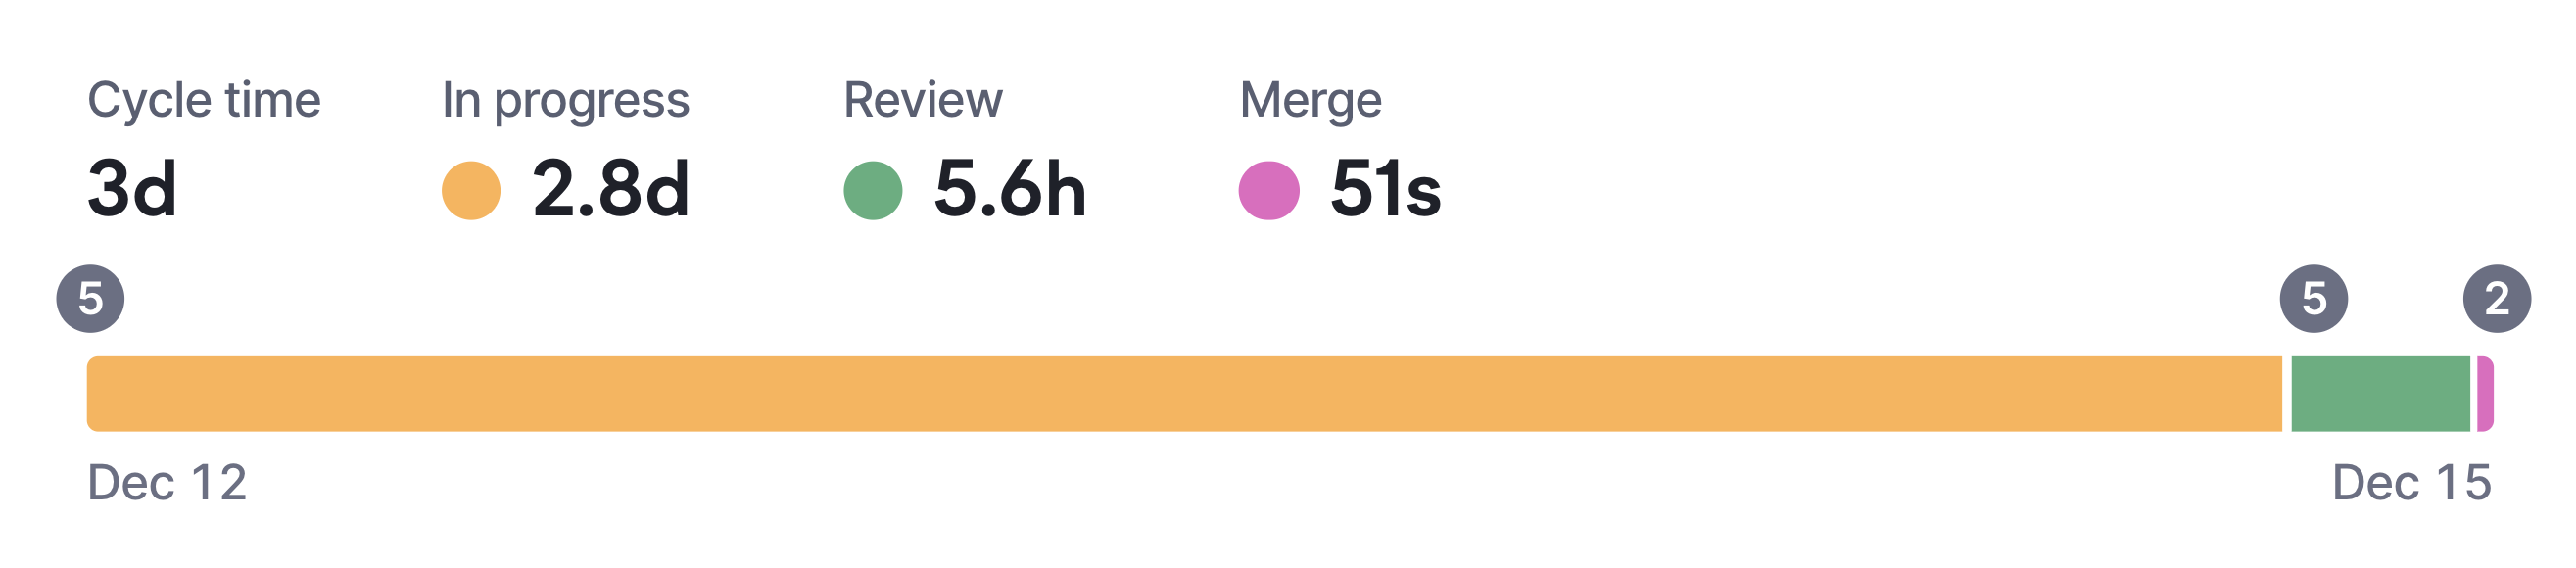
14. Cycle time breakdown
Cycle time is the total time a pull request spends in all stages of the development pipeline. It’s similar to change lead time above, but doesn’t include time to deploy. How different organizations define the stages can vary, but breaking it into stages helps reveal exactly where work gets stuck:
Time in progress — from the first commit or from when the pull request is opened, whichever happens first, to the first review request.
Time in review — from the first review request (or from when the pull request was opened, if none) to the final approval.
Time to merge — from the final approval to when the pull request is merged.
Cycle time breakdown in Swarmia.
What it tells you: This breakdown reveals patterns you can’t see in a single team’s numbers. If one team’s review stage consistently takes three times longer than others, go and find out why. Maybe they’re understaffed, maybe they have a knowledge silo, or maybe their codebase is more complex.
What to do about it: Use cycle time to identify patterns, not to drive improvement on any single team. When you see significant variance, your first conversation should be with the team’s lead or a senior engineer to understand context before jumping to solutions.
15. Batch size
Batch size is the number of code lines changed (added + deleted) in a pull request. Smaller changes get reviewed faster and more thoroughly, and most teams see measurable improvements when they keep changes under 400 lines.
What it tells you: Large PRs slow down everything. They take longer to review because they require more context, and people avoid picking them up. This creates a vicious cycle where large PRs sit longer, which encourages engineers to batch up even more work before opening the next one.
What to do about it: Help teams establish working agreements around PR size. Track the metric over time to see if the agreements are working. If PRs are routinely large, dig into why. Sometimes it’s the nature of the work. More often it’s unclear requirements or missing feature flags to hide work in progress — and these days it’s frequently a task handed to an agent without a clear definition of done.
16. Time to first review
Time to first review (the gap between opening a PR and getting a first look) is where most delays happen. Engineers finish their work, open a PR, and then nothing happens for days.
What it tells you: Long pickup times signal that code review isn’t prioritized or that notifications (if they exist) aren’t reaching the right people. This metric often reveals a cultural issue more than a technical one. If you’ve introduced review agents, watch this metric and metric 7 together: an agent that comments within a minute can make the number look great while the human review it’s meant to support gets slower.
What to do about it:Slack notifications that surface waiting PRs can cut this time dramatically. Help teams establish working agreements around review turnaround time — many teams aim for reviews to start within 4 hours.
17. Build time and CI feedback speed
If your CI pipeline takes 30 minutes and engineers run it five times a day, that’s 2.5 hours of waiting per person. Across a team of eight, that adds up to around 100 engineering hours a week. At enterprise scale, that number gets very big, very fast.
And sure, you can go and work on a bunch of other stuff while you’re waiting, but that comes with its own set of problems.
What it tells you: Build times set how fast engineers can iterate. Slow CI pipelines create a bottleneck in the development flow — engineers either wait for builds to complete or context-switch to other work, both of which slow down delivery and increase cognitive load. Agents make this more expensive than it used to be, because an agent working through a task can trigger a lot of pipeline runs.
What to do about it: Shaving even a few minutes off a frequently run build can save hundreds of engineering hours over a year. Look for opportunities to speed up CI by parallelizing jobs, caching dependencies, or splitting slow test suites. Treat fast, reliable feedback as core delivery infrastructure, not a nice-to-have to tackle “later.”
Understanding where engineering effort goes
These are less hard-and-fast engineering metrics, but they help you make informed decisions about where engineering effort goes and have data-informed conversations about capacity.
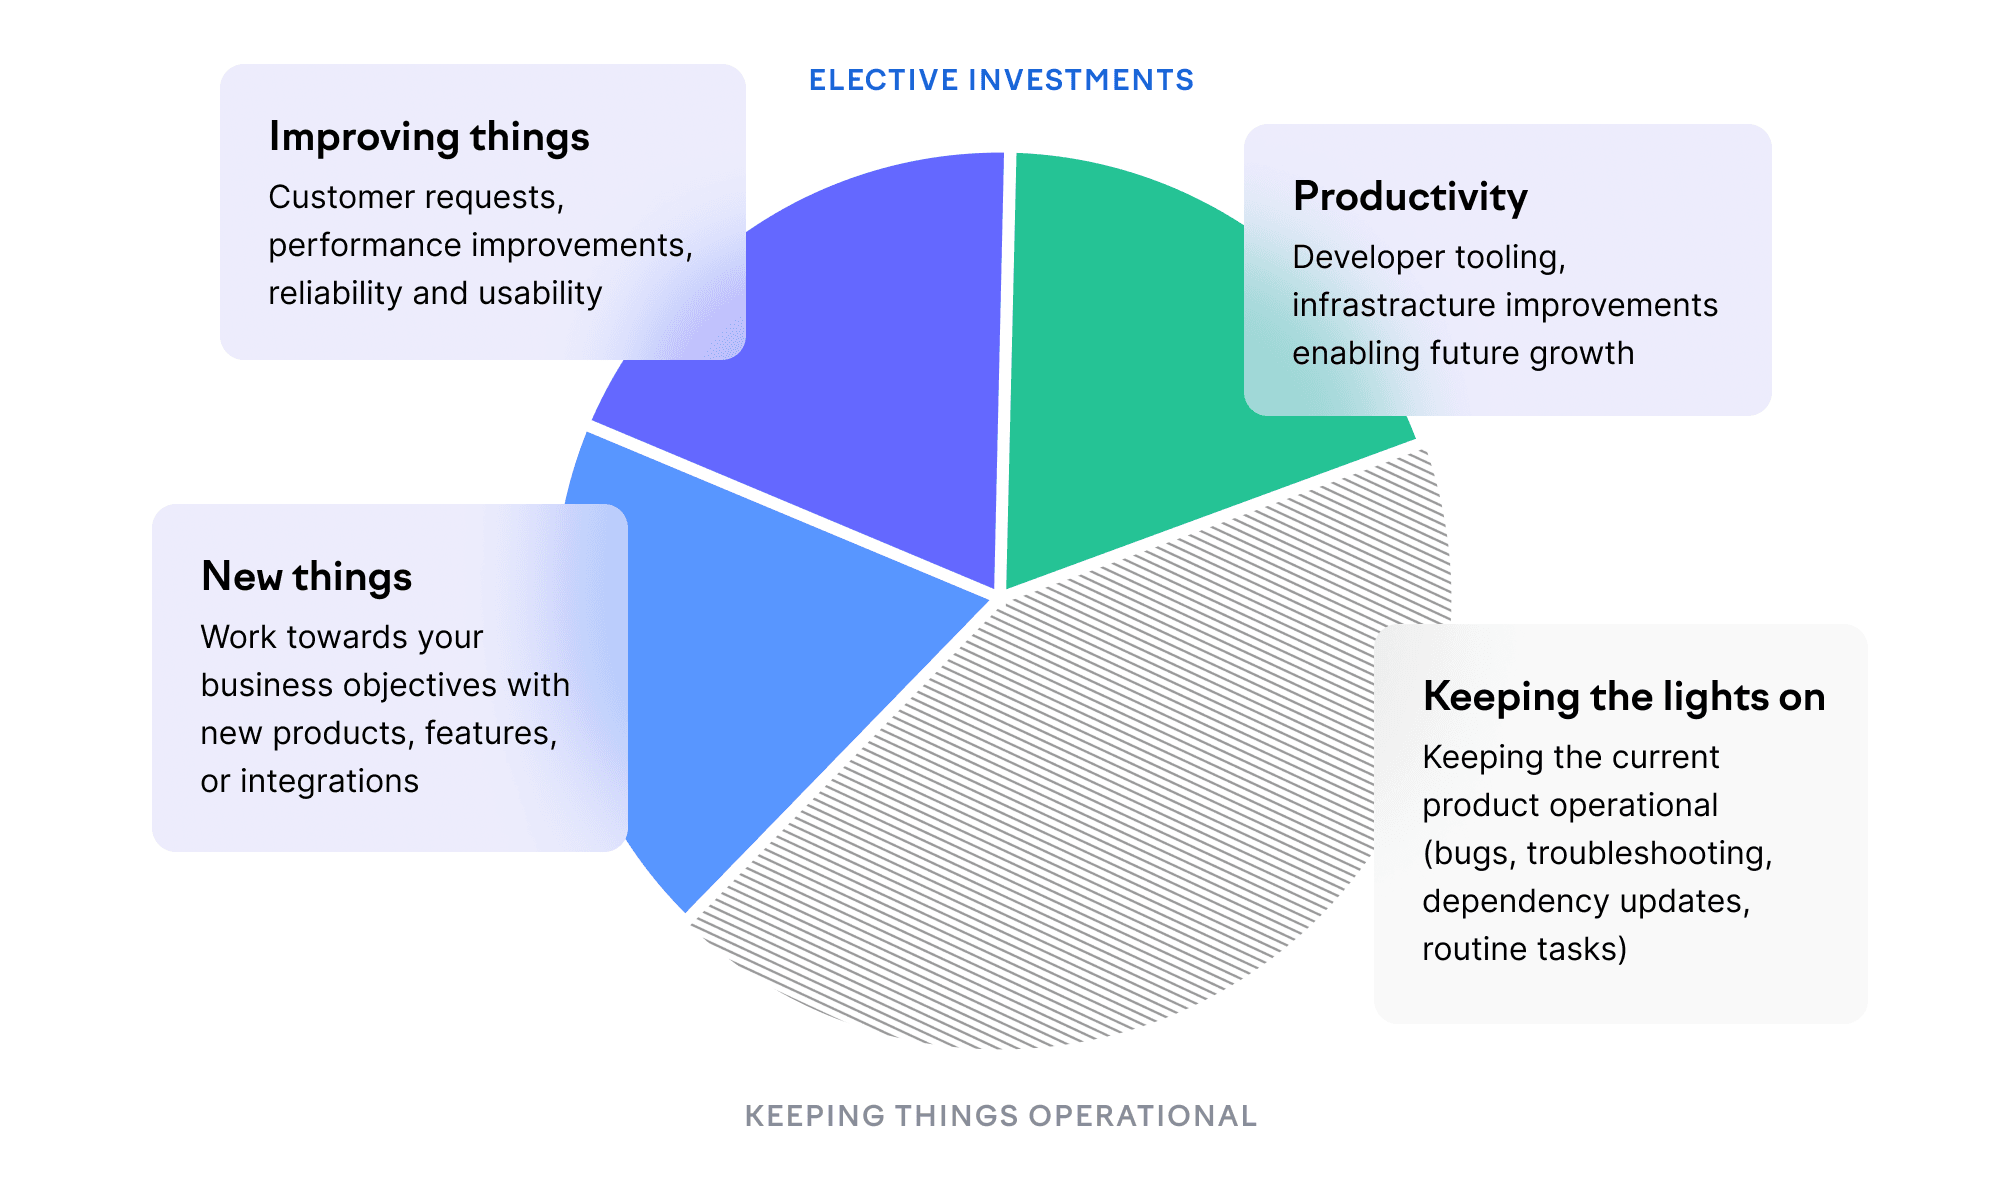
18. Investment balance
Investment balance is the percentage of time spent on new things, improvements, productivity, and keeping the lights on. Before having a reliable measurement of your org’s investment balance, the difference between where most leaders think engineering effort goes versus where it actually goes can be quite an eye-opener.
Understanding your investment balance is the foundation for better decision-making.
What it tells you: Without visibility here, you’ll assume most engineering time goes toward building new things, or making improvements. The reality is often different — many teams spend 40–50% of their time on maintenance and unplanned work. [SOURCE NEEDED for the 40–50% figure, or soften to “40% or more”] Some systems need more upkeep than others, so this isn’t inherently bad. But if your roadmap assumes 80% feature capacity and reality is 50%, you’ll keep missing commitments.
What to do about it:Investment balance is most valuable as a conversation starter. When you can show that a team spends 80% of their time keeping the lights on, it’s easier to make the case for refactoring or additional headcount. At the organizational level, use Swarmia’s investment balance view to understand whether your allocation matches strategic priorities.
This data is useful in executive and board conversations about engineering capacity. When stakeholders push for more features, you can show exactly where engineering time is going and make informed tradeoffs about what to deprioritize. With engineering cost and AI cost attached to those categories, the same view answers the finance version of the question: what each of them cost you last quarter.
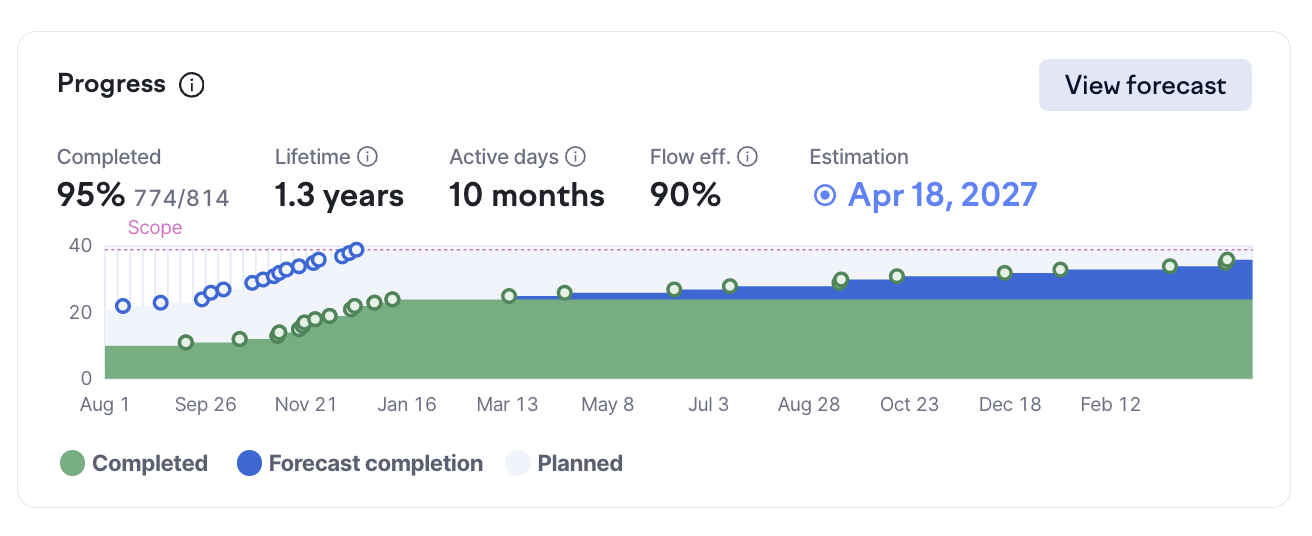
19. Planning accuracy
Planning accuracy tracks what teams planned to ship versus what shipped. You can track this a bunch of different ways, depending on whether you use deadlines and how you estimate work (as long as it’s not using story points, you’re good).
Initiative progress and forecasting in Swarmia.
What it tells you: This matters more at scale, when predictability becomes important for coordinating across teams and communicating with stakeholders. Consistently low accuracy suggests problems with estimation, scope creep, or interruptions. Consistently high accuracy is a good problem to have, but it could mean teams are being too conservative.
What to do about it: Treat planning accuracy as a diagnostic rather than a target (no “we must hit XX% accuracy in H2”) and use it to identify teams that might need help with estimation or that are dealing with excessive interruptions.
Developer experience metrics
Numbers tell you what’s happening, but not why — or whether your engineering organization is a place people want to stay. Developer experience directly impacts both engineering productivity and your ability to deliver on planned business outcomes. Poor developer experience costs you talented people, and it slows down everything your teams are trying to do.
20. Developer survey data
Survey data captures what metrics miss: whether engineers feel productive, whether tools help or frustrate them, whether they have enough uninterrupted time for deep work, and whether they understand how their work connects to business goals.
What it tells you: Developer experience affects retention, and replacing engineers is expensive. Survey data often uncovers issues that system metrics miss — like a cumbersome deployment process, lack of psychological safety, or meeting overload.
What to do about it: The key is asking questions you can act on. “Rate your job satisfaction from 1–5” produces a number without context, while “Our automated tests catch issues reliably.” gives you something to fix. Run developer experience surveys regularly (quarterly tends to work well for org-wide surveys) and close the loop to show how people’s feedback led to changes. Questions about AI tools belong in the same survey as the ones about tests, tooling, and review — not a separate AI pulse survey.
Codebase health signals
As an engineering leader, you might be thinking more and more about code quality — especially as teams adopt AI coding tools and ship more changes faster, sometimes with less scrutiny. The challenge is that most traditional code quality metrics are easy to misunderstand and misuse, and hard to act on without context.
Codebase health decides how expensive your systems are to change later, but these signals work best as indicators of risk, not performance targets.
Test coverage (track trends, not targets): Coverage is most useful when you look at how it changes over time, especially in fast-moving or high-risk parts of the codebase. Declining coverage alongside increasing change suggests that risk is accumulating faster than it’s being paid down. Stable coverage in stable systems is often fine.
Code churn (where change is concentrated): Churn shows where code is being rewritten frequently. High churn can reflect learning, refactoring, or unclear requirements; low churn in critical systems can signal fear of touching brittle code. Use churn to decide where to ask questions, not to tell teams to “rewrite less.”
Codebase risk (rather than a single “quality” score): Instead of scrutinizing code quality metrics directly, look at where technical risk turns up in outcomes: repeated incidents, rising rework, slower recovery times, and longer review cycles. These patterns often reveal systems that are becoming fragile or expensive to change.
Concentration of change (what’s being touched, and by whom): When a system is being changed largely by agents, or largely by one person, the people expected to maintain it may not understand it. That’s a knowledge risk before it’s a quality risk, and you’ll see it in how long the next change to that system takes.
Used this way, codebase health metrics help engineering leaders decide where to invest — in refactoring, platform work, or ownership changes — without turning quality into a scoreboard.
When metrics go wrong
Using arbitrary metrics (as in, metrics alone) to evaluate individuals. Commits per day, PRs merged, lines of code written — these numbers are easy to collect but they almost always measure the wrong thing.
Software development is collaborative. The engineer who spends a day helping three teammates get unstuck has contributed enormously, but their commit count is zero (and so what?). The engineer who writes a thousand lines of code that creates technical debt for years shows up great on some activity metrics.
AI metrics have made this failure mode easier to fall into, because tool vendors report usage per person by default and the numbers look like productivity data. They aren’t. An engineer with low AI usage might be working on the system nobody wants an agent anywhere near.
And then there’s Goodhart’s Law, which gets touted a lot in metrics discussions: when a measure becomes a target, it stops being a good measure.
The solution is transparency and shared ownership:
Make metrics visible to everyone, not just management.
Be clear about which metrics are for teams to use and which are about teams for organizational visibility.
Involve teams in selecting the metrics that matter to them.
Use aggregate data and trends for leadership decisions; don’t dive into individual performance.
When setbacks happen, ask “what can we learn?” rather than “whose fault is this?”
If you can’t explain why you’re tracking something, or if teams feel surveilled rather than supported, you’ve chosen the wrong metrics or communicated poorly about their purpose.
Start with one problem
If you’re not tracking any engineering metrics today, resist the urge to instrument everything at once. Pick one problem you can feel — slow code reviews, unpredictable delivery times, too much time firefighting, an AI bill nobody can explain — and measure that. See if you can improve it. Check whether the improvement stuck.
Once you’ve got that working, decide whether it deserves active management as a KPI or whether it’s just a useful diagnostic to check periodically. Then pick the next problem.
The specific metrics are less important than building the habit: looking at data, asking what it means, deciding what to do, and following through. Be clear about who each metric serves and what they’ll do with it.
Lead your engineering organization with clarity
Swarmia helps you understand organizational health, spot systemic issues, and have informed conversations with stakeholders — without chasing down data from teams.

'%20stroke='url(%23paint1_linear_110_4764)'%20stroke-width='0.5'/%3e%3cdefs%3e%3clinearGradient%20id='paint0_linear_110_4764'%20x1='19.651'%20y1='5.88916'%20x2='19.651'%20y2='27.8676'%20gradientUnits='userSpaceOnUse'%3e%3cstop%20offset='0.1'%20stop-color='%235549C2'/%3e%3cstop%20offset='0.9'%20stop-color='%2370C9E4'/%3e%3c/linearGradient%3e%3clinearGradient%20id='paint1_linear_110_4764'%20x1='19.651'%20y1='5.88916'%20x2='19.651'%20y2='27.8676'%20gradientUnits='userSpaceOnUse'%3e%3cstop%20stop-color='%234D3DDD'/%3e%3cstop%20offset='0.322115'%20stop-color='%2364CDED'/%3e%3cstop%20offset='0.5'%20stop-color='%23736CFF'/%3e%3cstop%20offset='0.75'%20stop-color='%2364CDED'/%3e%3cstop%20offset='1'%20stop-color='%234D3DDD'/%3e%3c/linearGradient%3e%3c/defs%3e%3c/svg%3e)


'%20stroke='url(%23paint1_linear_110_4820)'%20stroke-width='0.5'/%3e%3cdefs%3e%3clinearGradient%20id='paint0_linear_110_4820'%20x1='20.0002'%20y1='4.11661'%20x2='20.0002'%20y2='33.8832'%20gradientUnits='userSpaceOnUse'%3e%3cstop%20offset='0.1'%20stop-color='%235549C2'/%3e%3cstop%20offset='0.9'%20stop-color='%2370C9E4'/%3e%3c/linearGradient%3e%3clinearGradient%20id='paint1_linear_110_4820'%20x1='20.0002'%20y1='4.11661'%20x2='20.0002'%20y2='33.8832'%20gradientUnits='userSpaceOnUse'%3e%3cstop%20stop-color='%234D3DDD'/%3e%3cstop%20offset='0.322115'%20stop-color='%2364CDED'/%3e%3cstop%20offset='0.5'%20stop-color='%23736CFF'/%3e%3cstop%20offset='0.75'%20stop-color='%2364CDED'/%3e%3cstop%20offset='1'%20stop-color='%234D3DDD'/%3e%3c/linearGradient%3e%3c/defs%3e%3c/svg%3e)

'%3e%3cpath%20d='M12.9414%2023.0626C12.6251%2023.0626%2012.3687%2023.319%2012.3687%2023.6354L12.3687%2025.1077C12.3687%2025.424%2012.6251%2025.6805%2012.9414%2025.6805H12.9868C14.4524%2025.6805%2016.6386%2025.6805%2018.1041%2025.6805H18.1622C18.4785%2025.6805%2018.735%2025.424%2018.735%2025.1077L18.735%2023.6354C18.735%2023.319%2018.4785%2023.0626%2018.1622%2023.0626H12.9414Z'%20fill='%23899FCF'/%3e%3cpath%20d='M18.7514%2020.8724C18.7514%2020.0855%2019.1849%2019.3779%2019.764%2018.8452C21.016%2017.6937%2021.8005%2016.0418%2021.8005%2014.2067C21.8005%2010.727%2018.9796%207.90607%2015.4999%207.90607C12.0202%207.90607%209.19928%2010.727%209.19928%2014.2067C9.19928%2016.0435%209.9853%2017.6968%2011.2393%2018.8484C11.8181%2019.3799%2012.2511%2020.0866%2012.2511%2020.8724C12.2511%2021.1887%2012.5076%2021.4452%2012.8239%2021.4452H18.1786C18.495%2021.4452%2018.7514%2021.1887%2018.7514%2020.8724Z'%20fill='%23899FCF'/%3e%3c/g%3e%3cdefs%3e%3cclipPath%20id='clip0_111_18741'%3e%3crect%20width='19'%20height='19'%20fill='white'%20transform='translate(6%207.29321)'/%3e%3c/clipPath%3e%3c/defs%3e%3c/svg%3e)

'%3e%3cpath%20fill-rule='evenodd'%20clip-rule='evenodd'%20d='M24.0701%207.72604L20.7065%207.72604C20.3309%207.72604%2020.0265%208.03047%2020.0265%208.40599L20.0265%2011.7696C20.0265%2011.9911%2020.1324%2012.1879%2020.2964%2012.312L18.6479%2015.609L17.4892%2015.609L17.4944%2015.6038C16.454%2015.6038%2016.3965%2014.6207%2016.3934%2014.5122L16.3934%2012.3475C16.3934%2011.972%2016.089%2011.6676%2015.7134%2011.6676L12.3498%2011.6676C11.9743%2011.6676%2011.6699%2011.972%2011.6699%2012.3475L11.6699%2015.7111C11.6699%2015.748%2011.6728%2015.7842%2011.6785%2015.8195L9.81296%2019.5505L7.92995%2019.5505C7.55442%2019.5505%207.25%2019.8549%207.25%2020.2305L7.25%2023.594C7.25%2023.9696%207.55442%2024.274%207.92995%2024.274L11.2935%2024.274C11.6691%2024.274%2011.9735%2023.9696%2011.9735%2023.594L11.9735%2020.2305C11.9735%2020.0089%2011.8675%2019.8121%2011.7035%2019.688L13.352%2016.3911L14.6282%2016.3911C15.5514%2016.4636%2015.6058%2017.3707%2015.609%2017.4775L15.609%2019.6526C15.609%2020.0281%2015.9135%2020.3325%2016.289%2020.3325L19.6526%2020.3325C20.0281%2020.3325%2020.3325%2020.0281%2020.3325%2019.6526L20.3325%2016.289C20.3325%2016.2508%2020.3294%2016.2133%2020.3233%2016.1768L22.187%2012.4495L24.0701%2012.4495C24.4456%2012.4495%2024.75%2012.1451%2024.75%2011.7696L24.75%208.40599C24.75%208.03047%2024.4456%207.72604%2024.0701%207.72604Z'%20fill='%23899FCF'/%3e%3c/g%3e%3cdefs%3e%3cclipPath%20id='clip0_2772_12454'%3e%3crect%20width='20'%20height='20'%20fill='white'%20transform='translate(6%206)'/%3e%3c/clipPath%3e%3c/defs%3e%3c/svg%3e)


'%3e%3cpath%20d='M14.5615%2031.9046H25.9297C26.5036%2031.9046%2026.9697%2032.3701%2026.9697%2032.9437V35.7552L26.9639%2035.8616C26.9104%2036.3852%2026.4676%2036.7933%2025.9297%2036.7933H25.8037C25.1902%2036.7934%2024.6569%2037.0835%2024.1855%2037.4368C23.9487%2037.6144%2023.7206%2037.8125%2023.5029%2038.0062C23.2832%2038.2016%2023.0755%2038.3909%2022.8682%2038.5589C22.5182%2038.8424%2022.0724%2039.012%2021.5869%2039.012H18.8779C18.3922%2039.012%2017.9456%2038.8424%2017.5957%2038.5589C17.3883%2038.3909%2017.1806%2038.2016%2016.9609%2038.0062C16.7434%2037.8126%2016.516%2037.6143%2016.2793%2037.4368C15.8668%2037.1275%2015.4065%2036.8672%2014.8867%2036.8069L14.6611%2036.7933H14.5615C13.9879%2036.7931%2013.5235%2036.3288%2013.5234%2035.7552V32.9437C13.5235%2032.3701%2013.9878%2031.9047%2014.5615%2031.9046ZM20.3848%200.98761C27.847%200.98761%2033.8963%207.03716%2033.8965%2014.4993C33.8965%2018.4346%2032.2143%2021.9769%2029.5293%2024.4466C28.2431%2025.6297%2027.258%2027.2224%2027.2578%2029.014V29.015C27.2575%2029.5885%2026.7914%2030.054%2026.2178%2030.054H14.5586C13.985%2030.054%2013.5188%2029.5885%2013.5186%2029.015V29.014C13.5183%2027.2247%2012.5334%2025.6349%2011.248%2024.4544C8.55856%2021.9844%206.87305%2018.4383%206.87305%2014.4993C6.8732%207.03726%2012.9227%200.987767%2020.3848%200.98761ZM20.0518%2018.6585C19.6614%2018.6587%2019.3447%2018.976%2019.3447%2019.3665V26.6859C19.345%2027.0761%2019.6615%2027.3927%2020.0518%2027.3929H20.7178C21.1082%2027.3929%2021.4245%2027.0762%2021.4248%2026.6859V19.3665C21.4248%2018.9759%2021.1084%2018.6585%2020.7178%2018.6585H20.0518Z'%20fill='url(%23paint0_linear_166_518)'%20stroke='url(%23paint1_linear_166_518)'%20stroke-width='0.416667'/%3e%3c/g%3e%3cdefs%3e%3clinearGradient%20id='paint0_linear_166_518'%20x1='20.3849'%20y1='0.779602'%20x2='20.3849'%20y2='39.2204'%20gradientUnits='userSpaceOnUse'%3e%3cstop%20offset='0.1'%20stop-color='%235549C2'/%3e%3cstop%20offset='0.9'%20stop-color='%2370C9E4'/%3e%3c/linearGradient%3e%3clinearGradient%20id='paint1_linear_166_518'%20x1='20.3849'%20y1='0.779602'%20x2='20.3849'%20y2='39.2204'%20gradientUnits='userSpaceOnUse'%3e%3cstop%20stop-color='%234D3DDD'/%3e%3cstop%20offset='0.322115'%20stop-color='%2364CDED'/%3e%3cstop%20offset='0.5'%20stop-color='%23736CFF'/%3e%3cstop%20offset='0.75'%20stop-color='%2364CDED'/%3e%3cstop%20offset='1'%20stop-color='%234D3DDD'/%3e%3c/linearGradient%3e%3cclipPath%20id='clip0_166_518'%3e%3crect%20width='40'%20height='40'%20fill='white'/%3e%3c/clipPath%3e%3c/defs%3e%3c/svg%3e)


'%3e%3cpath%20d='M31.01%204.32568C29.1716%207.09907%2027.894%209.22748%2027.1194%2010.8218C26.607%2011.8752%2026.3824%2012.5664%2026.2971%2013.019C26.2127%2013.467%2026.2606%2013.7057%2026.3293%2013.8325V13.8335L26.3323%2013.8384C26.3498%2013.8686%2026.3918%2013.9371%2026.4934%2013.9897C26.5848%2014.0371%2026.7072%2014.0629%2026.8733%2014.063C27.2288%2014.063%2027.6883%2013.9506%2028.2385%2013.7456C28.7927%2013.5391%2029.4565%2013.2322%2030.2258%2012.8267C31.7308%2012.0333%2033.655%2010.8562%2035.9875%209.3042L36.3762%209.79346C34.0139%2012.0094%2032.1768%2013.8719%2030.9241%2015.5464C29.6466%2017.2539%2028.9592%2018.7892%2028.9592%2020.3247V20.5327H28.9709C29.0302%2021.999%2029.7102%2023.4718%2030.9299%2025.1021C32.1828%2026.7767%2034.0204%2028.6388%2036.3831%2030.855L35.9924%2031.3442C33.66%2029.7923%2031.7356%2028.6151%2030.2307%2027.8218C29.4616%2027.4163%2028.7984%2027.1093%2028.2444%2026.9028C27.6942%2026.6978%2027.2346%2026.5854%2026.8792%2026.5854C26.7132%2026.5855%2026.5907%2026.6114%2026.4993%2026.6587C26.3975%2026.7114%2026.3556%2026.7809%2026.3381%2026.811L26.3352%2026.8149C26.2662%2026.9414%2026.2184%2027.179%2026.303%2027.6274C26.3883%2028.0793%2026.6129%2028.7705%2027.1252%2029.8267C27.8998%2031.4207%2029.1724%2033.5483%2031.0159%2036.3218L30.5256%2036.7114C28.3119%2034.3499%2026.4515%2032.5118%2024.7776%2031.2583C23.0705%2029.98%2021.5349%2029.2915%2019.9983%2029.2915C18.4617%2029.2915%2016.9261%2029.98%2015.219%2031.2583C13.545%2032.5119%2011.6839%2034.3496%209.46997%2036.7114L8.97974%2036.3218C10.818%2033.5485%2012.0967%2031.4209%2012.8713%2029.8267C13.3835%2028.7736%2013.6082%2028.083%2013.6936%2027.6304C13.7782%2027.1812%2013.7304%2026.9415%2013.6614%2026.8149L13.6584%2026.811L13.6096%2026.7437C13.5843%2026.716%2013.5483%2026.6851%2013.4973%2026.6587C13.4059%2026.6114%2013.2834%2026.5855%2013.1174%2026.5854C12.7619%2026.5854%2012.303%2026.6978%2011.7532%2026.9028C11.1995%2027.1093%2010.5367%2027.4163%209.76782%2027.8218C8.26358%2028.6151%206.33836%2029.7912%204.00317%2031.3433L3.61841%2030.855C5.98121%2028.6386%207.81958%2026.7767%209.07251%2025.1021C10.3498%2023.3947%2011.0372%2021.86%2011.0374%2020.3247C11.0374%2018.7892%2010.35%2017.2539%209.07251%2015.5464C7.81948%2013.8716%205.9815%2012.0091%203.61841%209.79248L4.00317%209.3042C6.33861%2010.8564%208.26347%2012.0333%209.76782%2012.8267C10.5367%2013.2322%2011.1995%2013.5391%2011.7532%2013.7456C12.303%2013.9506%2012.7619%2014.063%2013.1174%2014.063C13.2835%2014.063%2013.4059%2014.037%2013.4973%2013.9897C13.5988%2013.9372%2013.6409%2013.8687%2013.6584%2013.8384L13.6614%2013.8335C13.7304%2013.707%2013.7783%2013.4696%2013.6936%2013.021C13.6083%2012.5691%2013.3837%2011.8779%2012.8713%2010.8218H12.8704C12.0956%209.22166%2010.8232%207.09888%208.97974%204.32568L9.46997%203.93701C11.6838%206.29874%2013.5434%208.13651%2015.2161%209.39014C16.9217%2010.6684%2018.4559%2011.3578%2019.9924%2011.3579C21.529%2011.3579%2023.0646%2010.6685%2024.7717%209.39014C26.4457%208.13661%2028.3061%206.29858%2030.5198%203.93701L31.01%204.32568Z'%20fill='url(%23paint0_linear_166_603)'%20stroke='url(%23paint1_linear_166_603)'%20stroke-width='0.416667'/%3e%3c/g%3e%3cdefs%3e%3clinearGradient%20id='paint0_linear_166_603'%20x1='20.001'%20y1='3.65479'%20x2='20.001'%20y2='36.9939'%20gradientUnits='userSpaceOnUse'%3e%3cstop%20offset='0.1'%20stop-color='%235549C2'/%3e%3cstop%20offset='0.9'%20stop-color='%2370C9E4'/%3e%3c/linearGradient%3e%3clinearGradient%20id='paint1_linear_166_603'%20x1='20.001'%20y1='3.65479'%20x2='20.001'%20y2='36.9939'%20gradientUnits='userSpaceOnUse'%3e%3cstop%20stop-color='%234D3DDD'/%3e%3cstop%20offset='0.322115'%20stop-color='%2364CDED'/%3e%3cstop%20offset='0.5'%20stop-color='%23736CFF'/%3e%3cstop%20offset='0.75'%20stop-color='%2364CDED'/%3e%3cstop%20offset='1'%20stop-color='%234D3DDD'/%3e%3c/linearGradient%3e%3cclipPath%20id='clip0_166_603'%3e%3crect%20width='33.3333'%20height='33.3333'%20fill='white'%20transform='translate(3.33167%203.65479)'/%3e%3c/clipPath%3e%3c/defs%3e%3c/svg%3e)





'%20fill='white'/%3e%3cpath%20d='M7.19995%2021.6808C7.19995%2020.3553%208.27447%2019.2808%209.59995%2019.2808H38.3999C39.7254%2019.2808%2040.7999%2020.3553%2040.7999%2021.6808V36.0808C40.7999%2037.4062%2039.7254%2038.4808%2038.4%2038.4808H9.59995C8.27447%2038.4808%207.19995%2037.4062%207.19995%2036.0808V21.6808Z'%20fill='%230A328F'/%3e%3cpath%20d='M22.4787%2029.5558L12.0292%2023.407C11.4796%2023.0835%2011.1421%2022.4934%2011.1421%2021.8556V13.8165C11.1421%2012.491%2012.2166%2011.4165%2013.5421%2011.4165H34.4584C35.7838%2011.4165%2036.8584%2012.491%2036.8584%2013.8165V21.8556C36.8584%2022.4934%2036.5209%2023.0835%2035.9712%2023.407L25.5216%2029.5558C24.5826%2030.1084%2023.4178%2030.1084%2022.4787%2029.5558Z'%20fill='%2340D1F1'/%3e%3cpath%20d='M16.8351%2016.5635L31.1649%2016.5635'%20stroke='%230A328F'%20stroke-width='2.4'%20stroke-linecap='round'%20stroke-linejoin='round'/%3e%3cpath%20d='M16.8351%2021.2124L24%2021.1465'%20stroke='%230A328F'%20stroke-width='2.4'%20stroke-linecap='round'%20stroke-linejoin='round'/%3e%3c/svg%3e)


